D3.js
Description
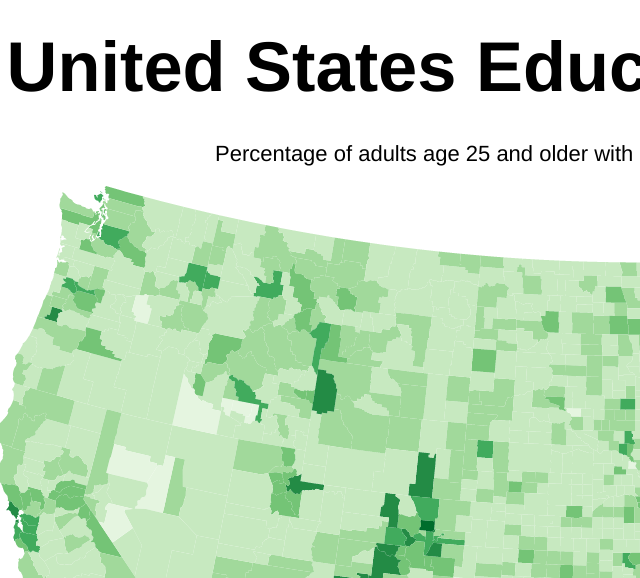
This visualization written with D3.js looks at the percentage of adults age 25 and older with a bachelor's degree or higher (2010-2014) for each county in the U.S.
Description
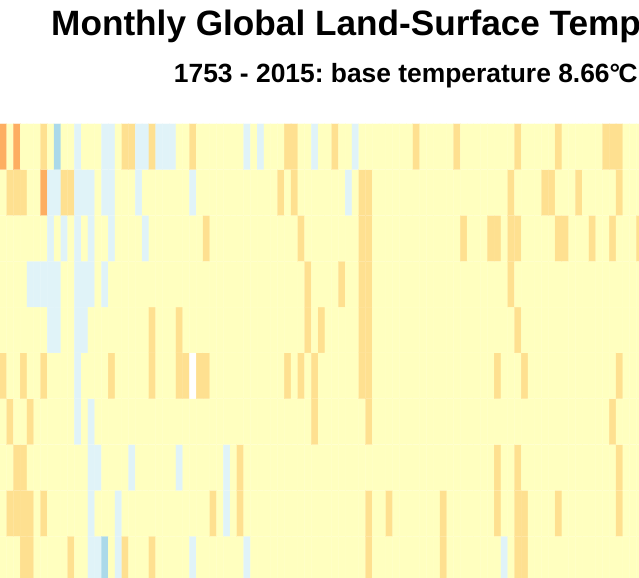
This visualization written with D3.js looks at the Monthly Global Land-Surface Temperature from 1753 - 2015
Description
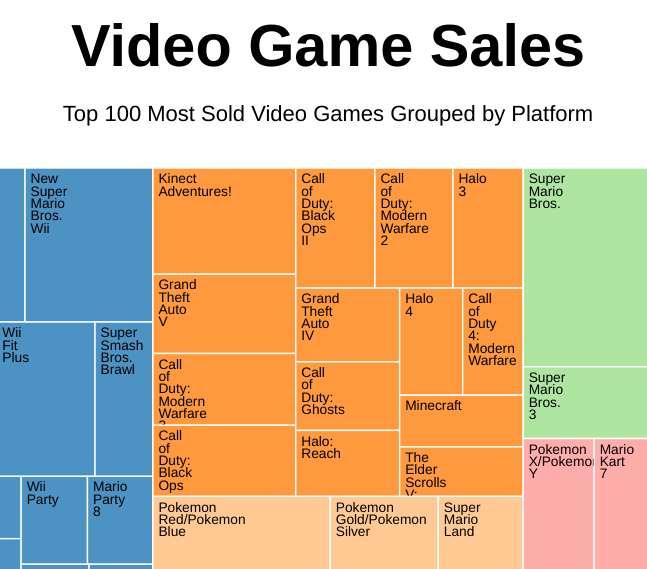
This visualization written with D3.js looks at the Top 100 Most Sold Video Games Grouped by Platform
Description
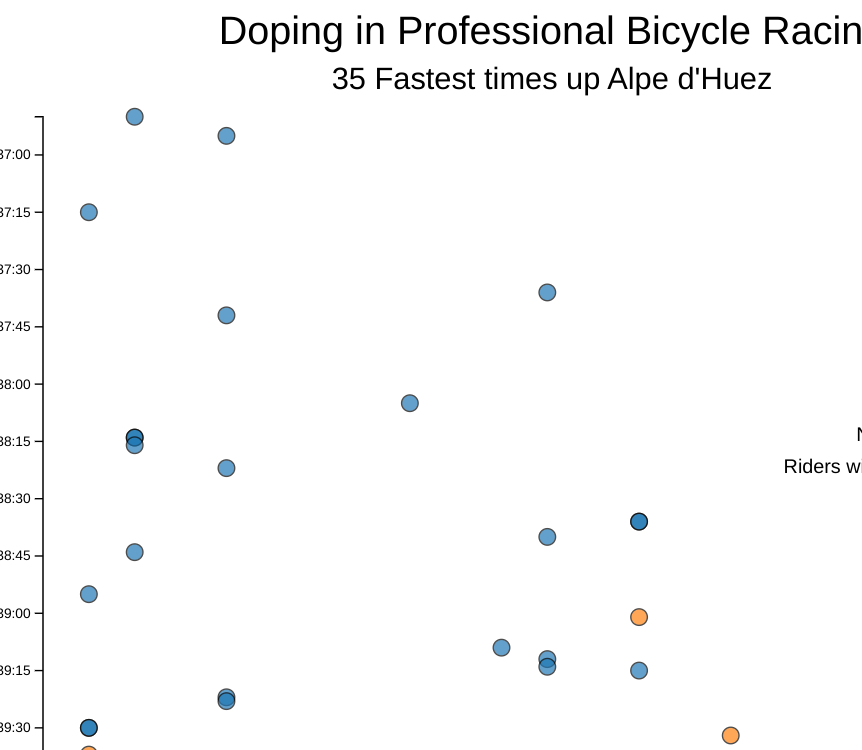
This visualization written with D3.js looks at Doping in Professional Bicycle Racing, in particular, the 35 Fastest times up Alpe d'Huez
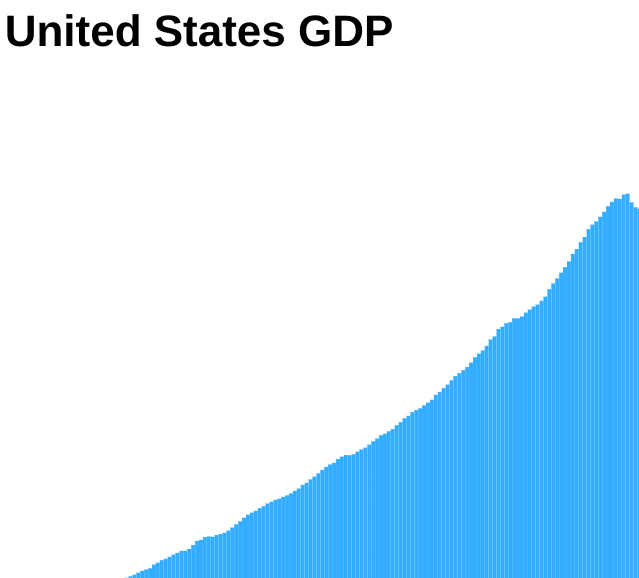
Description
This visualization written with D3.js looks at the United States GDP between 1947 - 2015